library(tidyverse)

plot <- ggplot(Indometh, aes(x=time, y=conc, )) +
    geom_line(aes(color=Subject), linewidth=1) +
    geom_point(aes(color=Subject),size=1.5) +
    theme_bw() +
    theme(legend.position = "none")
print(plot)ggplot2グラフの背景透過
備忘録
R
ggplot2
ggplot2で作成したグラフの背景を、
themeをいじることで透過させます。
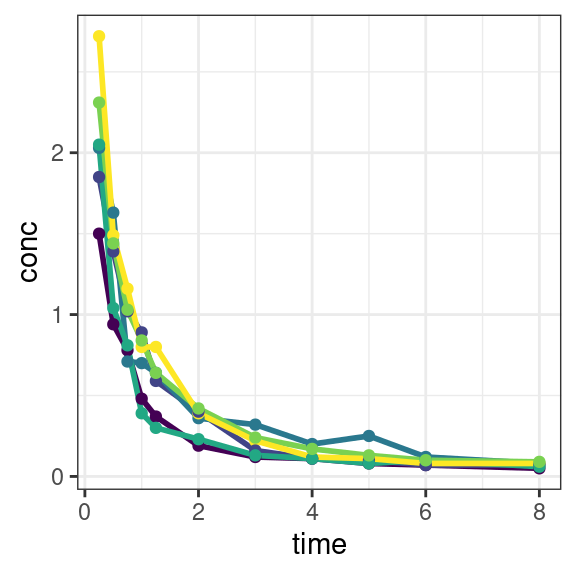
例として、次のグラフを考えます。
コード
実行結果
ここで作成したggplot2のグラフの背景を透過させるためには、theme()内で、panel.backgroundとplot.backgroundの背景を透過させます。
具体的には、次のようにします。
plot <- plot +
    theme(
        panel.background = element_rect(fill = "transparent", color = NA),
        plot.background = element_rect(fill = "transparent", color = NA)
    )
その結果、次のように、グラフの背景が透過されます。
背景透過前
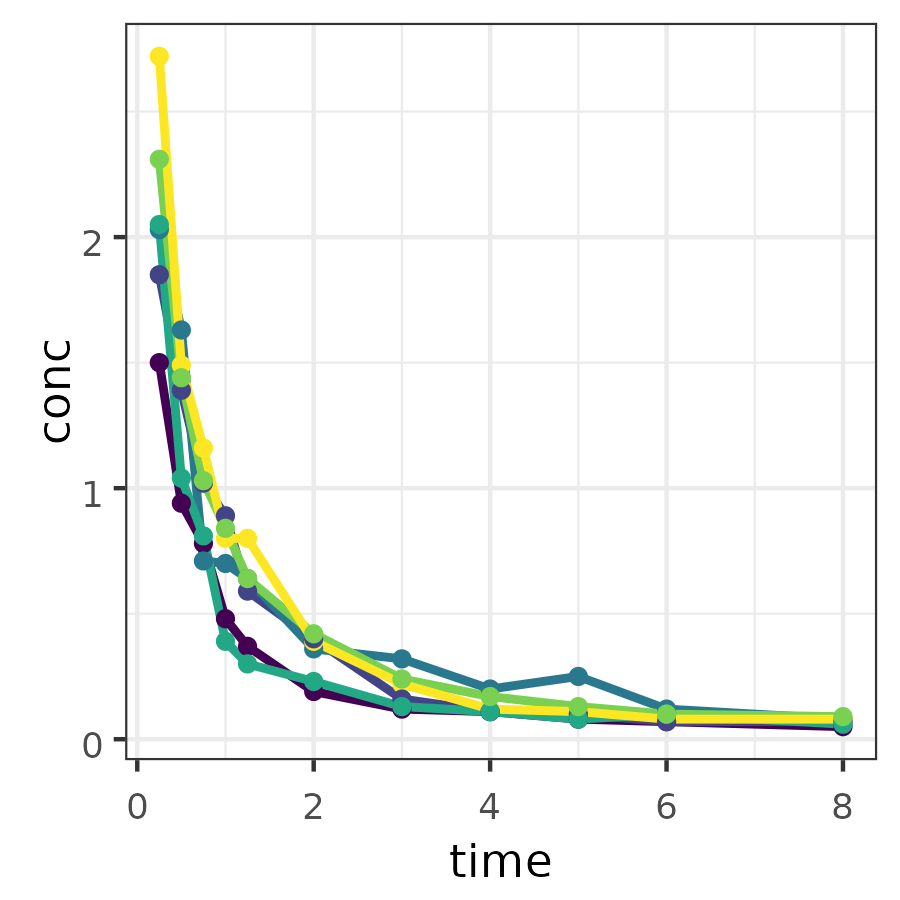
背景透過後
![]()
実用的には、背景透過のテーマを作っておいて、それを指定するのが便利です。
mytheme.R
transparent_theme <- theme(
    panel.background = element_rect(fill = "transparent", color = NA),
    plot.background = element_rect(fill = "transparent", color = NA)
)
plot.R
# 作ったテーマが入っているファイルを読み込んで
source('./mytheme.R')
# plotに足す
plot <- plot +
    transparent_theme